
Chapter 8Investor priorities
Investors use impact data to seek profits and manage risk
In the past few years, it has been impossible to escape the impact and ESG talk in investment seminars, communities and media. However, impact and sustainability data can form a jungle many asset managers get lost in, and an “ESG fund” is not necessarily even net positive.
But why exactly do investors use time and money to understand and optimize the impact of their investments? What kinds of impact do asset owners and managers currently prioritize and why? And how is the general quality of impact data available today perceived?
We asked professional investors these questions. 163 asset owners and managers from 15 countries shared their views. Here’s what they said.
Seeking financial returns is the primary motivation for pursuing impact
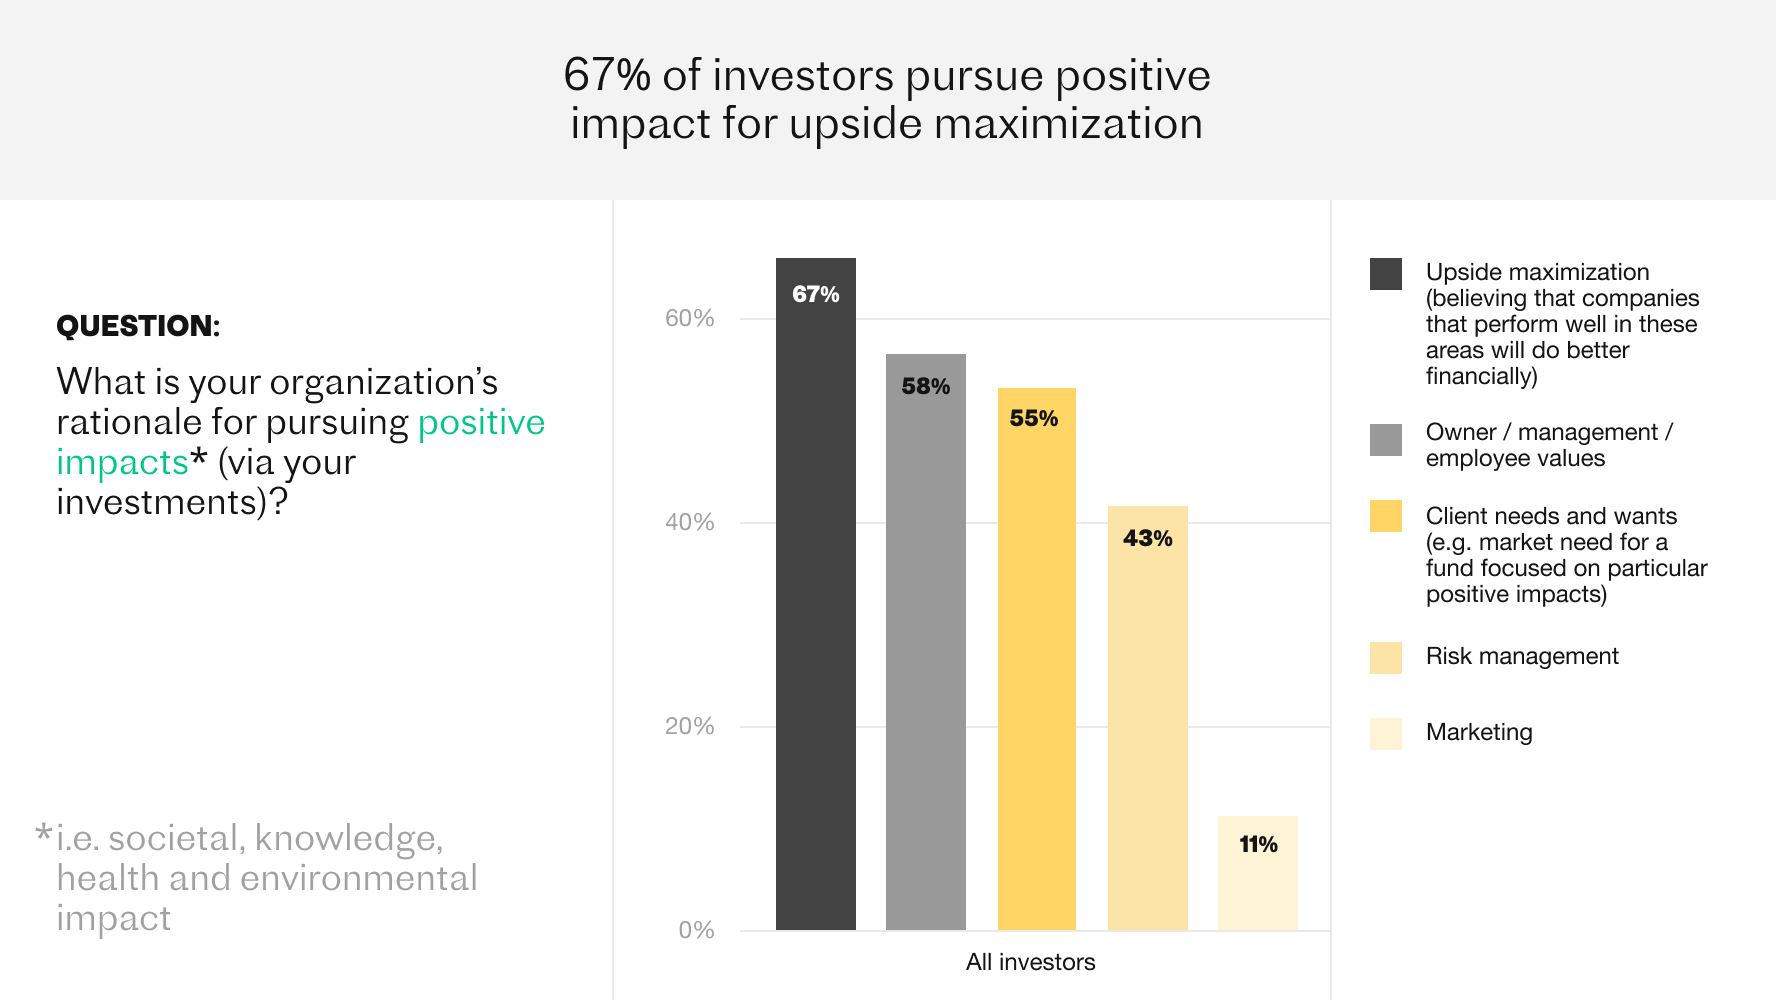
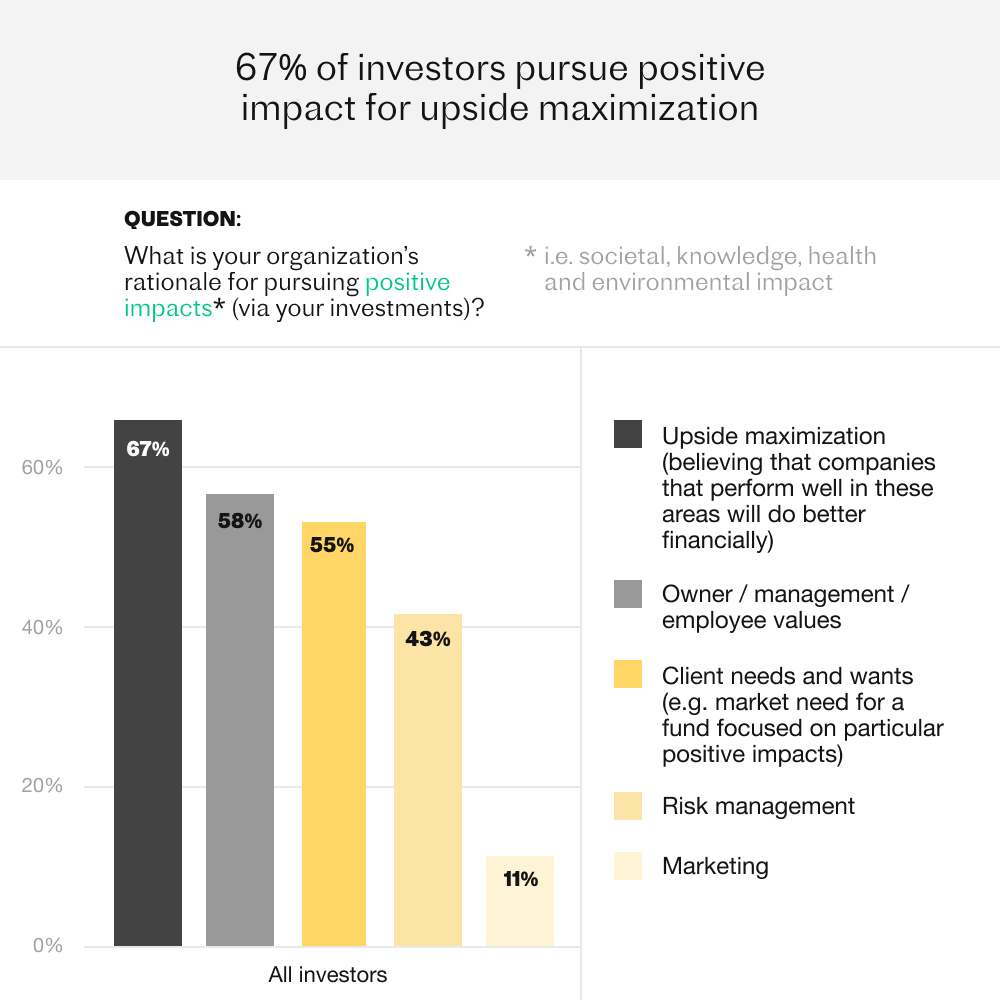
Pursuing positive and avoiding negative impacts of investments may be driven by a range of different motivations. To explore this, we asked the respondents separately what drives them to pursue positive impacts and avoid negative ones.
67 % of respondents believe that companies that perform well in impact do better financially and state upside maximization as a rationale for pursuing positive impacts.
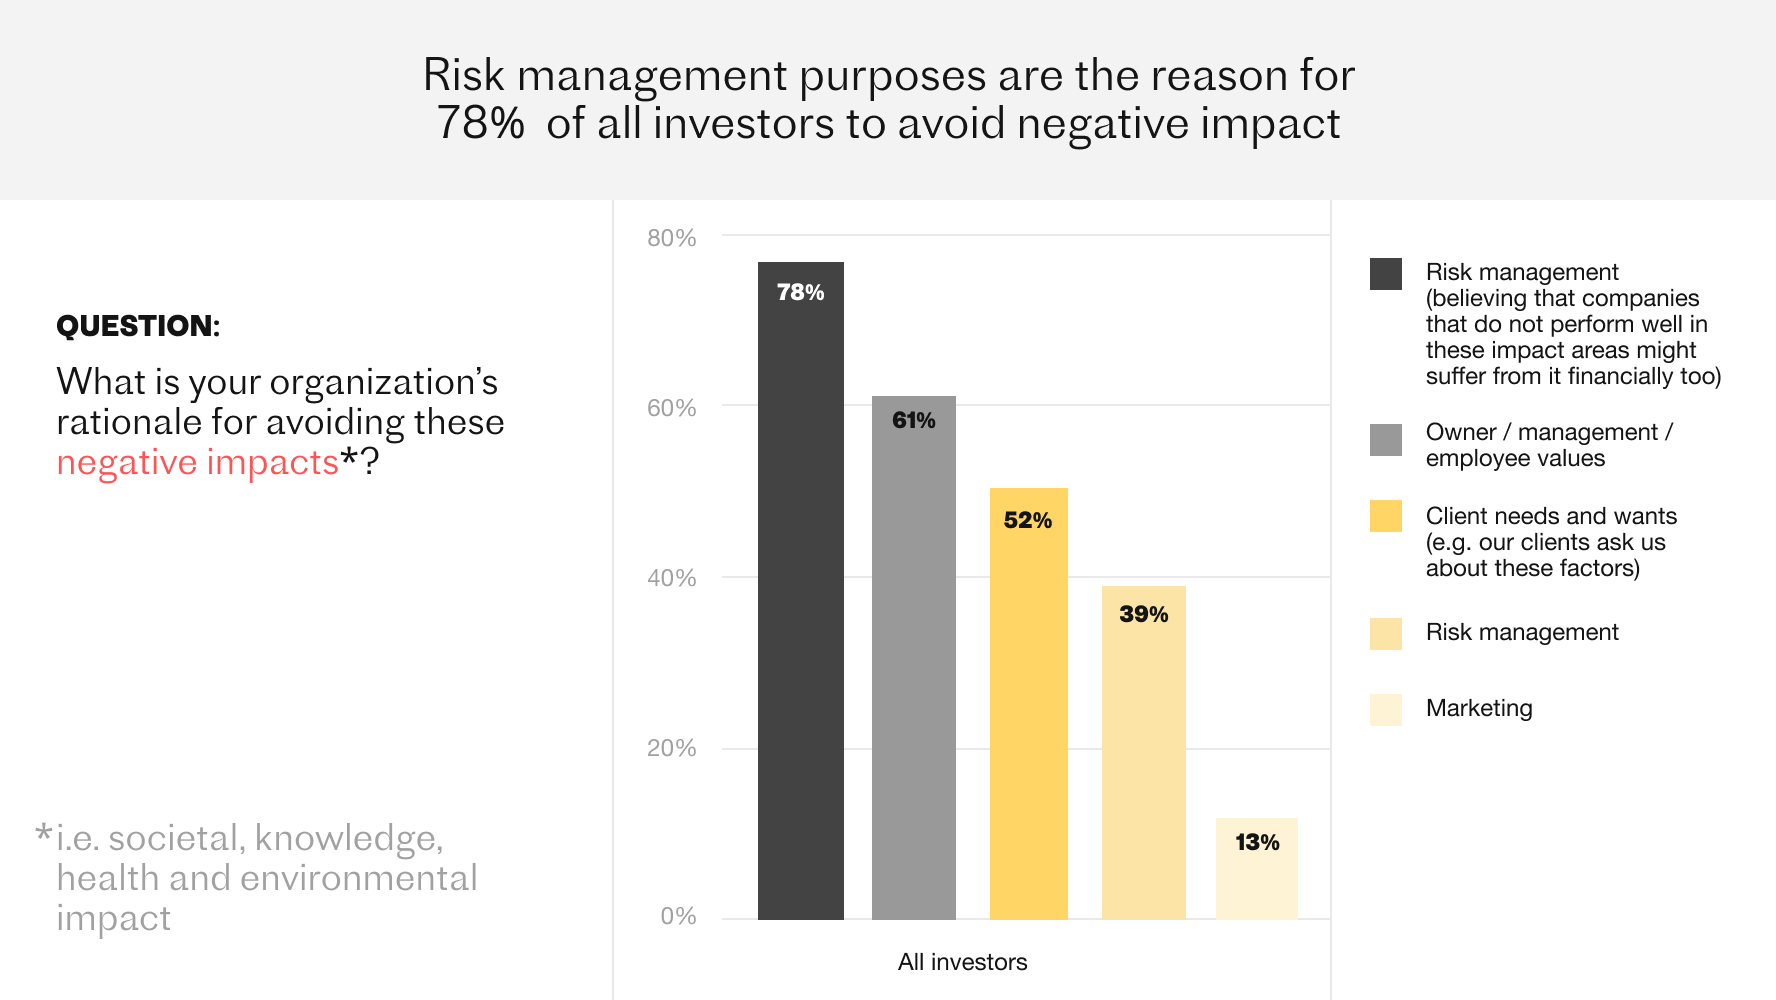
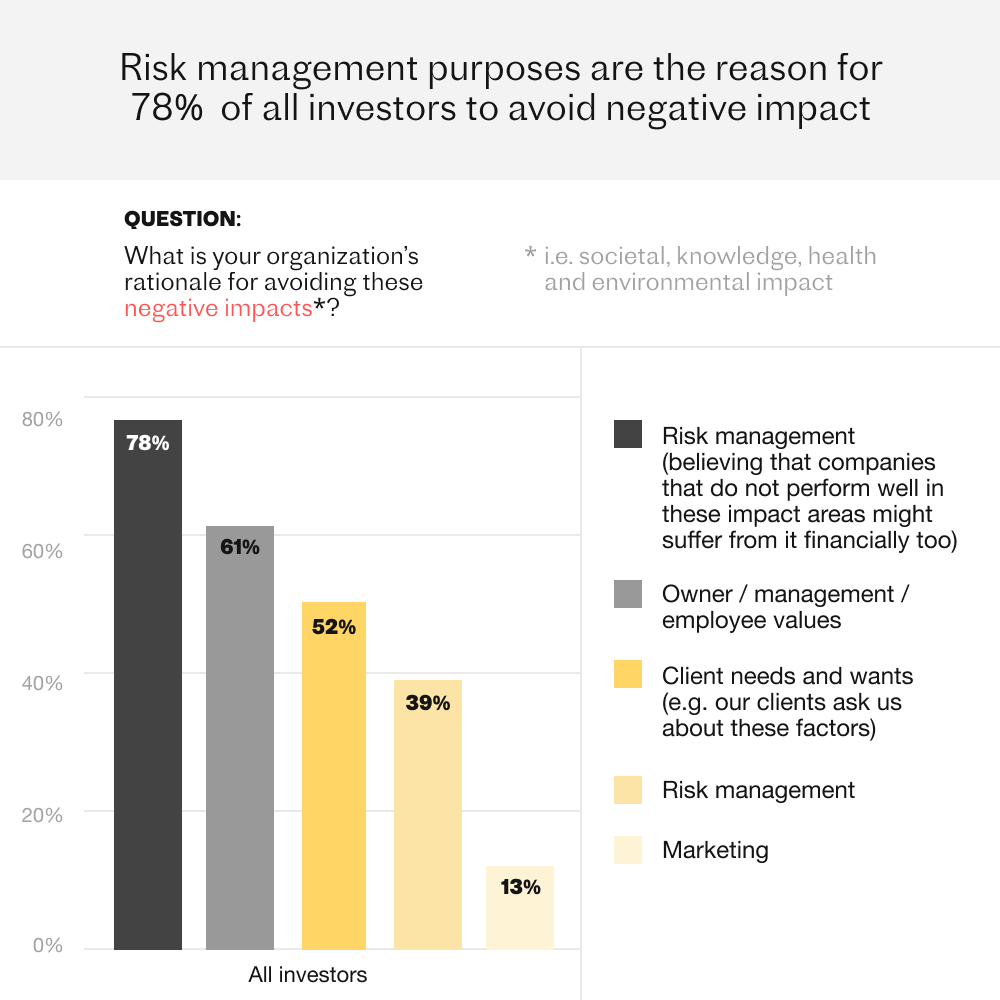
Risk management still has its place, too. Staying clear of investments with negative impacts is understandably largely driven by the desire to manage risks. 78 % of respondents stated they believe that companies that do not perform well in impact might suffer from it financially too.
Asset owners and managers prioritize differently
Compared to asset owners, asset managers are more likely to skew towards benefit generating investments. Asset managers prioritize pursuing positive impacts on society and knowledge, while asset owners consider avoiding negative impacts on the environment and knowledge more important (see Figure 8.3). Surprisingly, the trend is reversed in venture capitalist respondents who clearly emphasize avoiding harm in all impact categories.
While differences between asset manager and asset owner values and priorities are clear, priorities vary also based on the role of the respondent. For instance, investment company CEOs emphasize knowledge impacts, both positive and negative, compared to respondents in other roles. This dimension includes not just creation and distribution of knowledge, but also taking into account the use of scarce human capital - all topics currently ignored by almost all impact and ESG metrics.
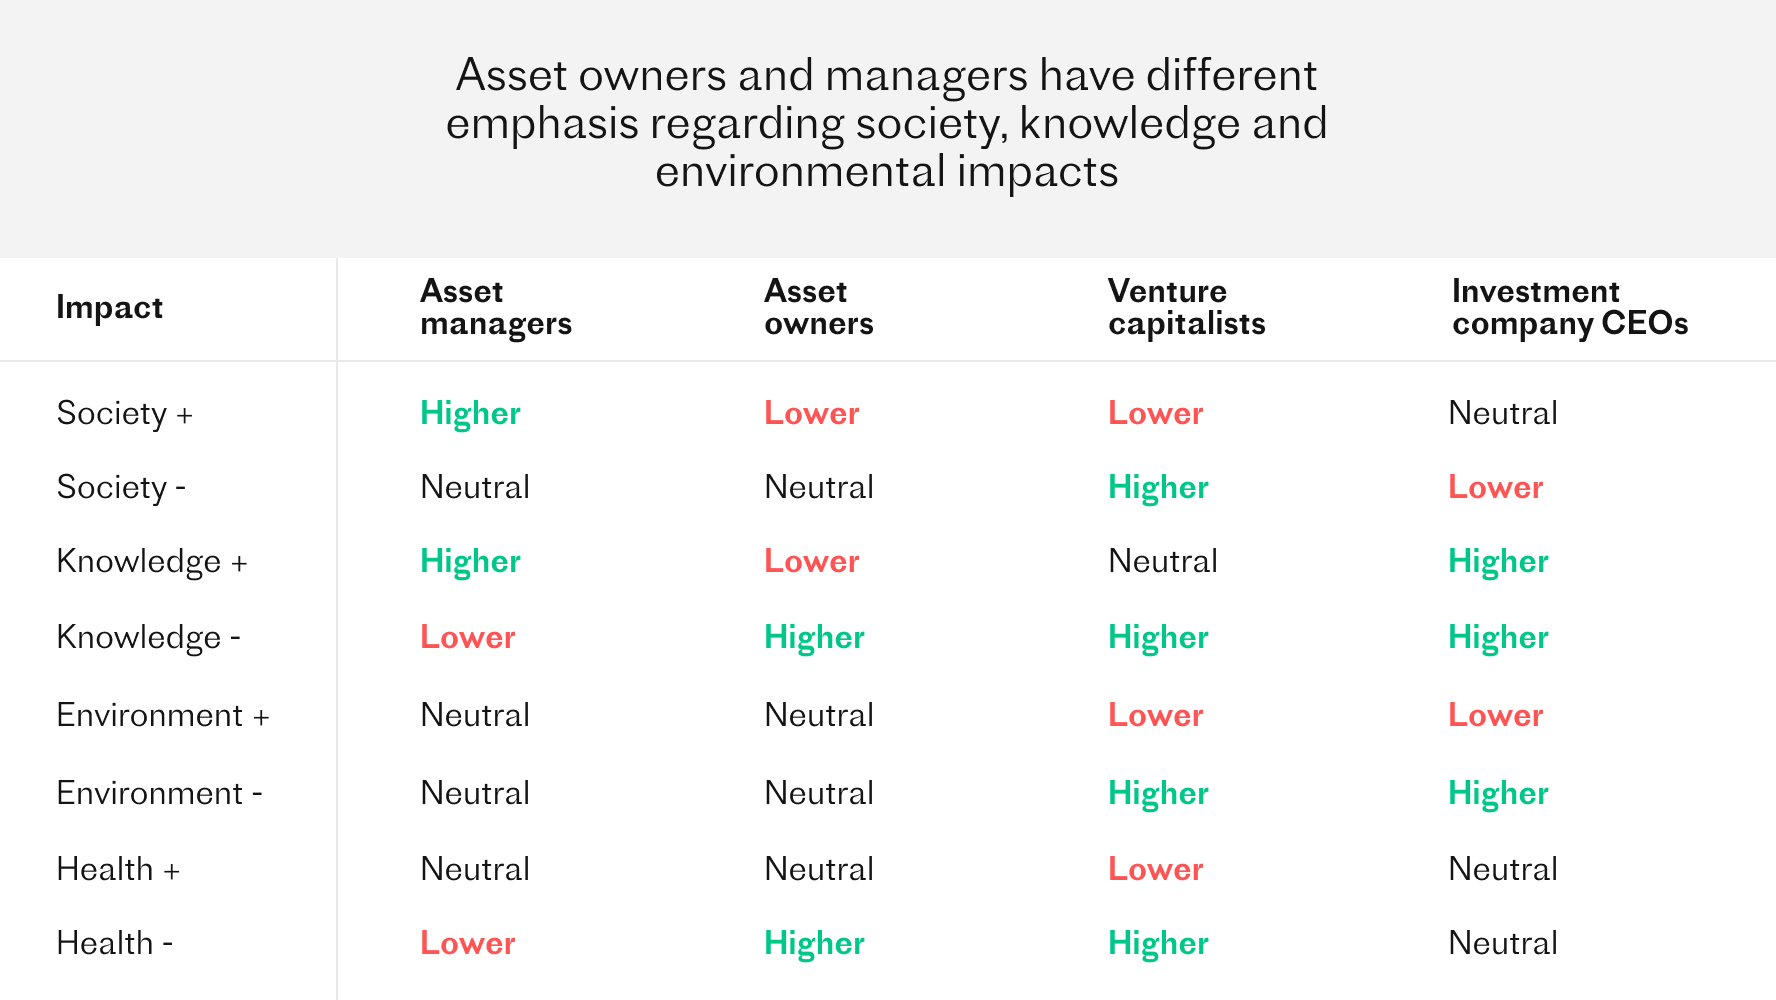
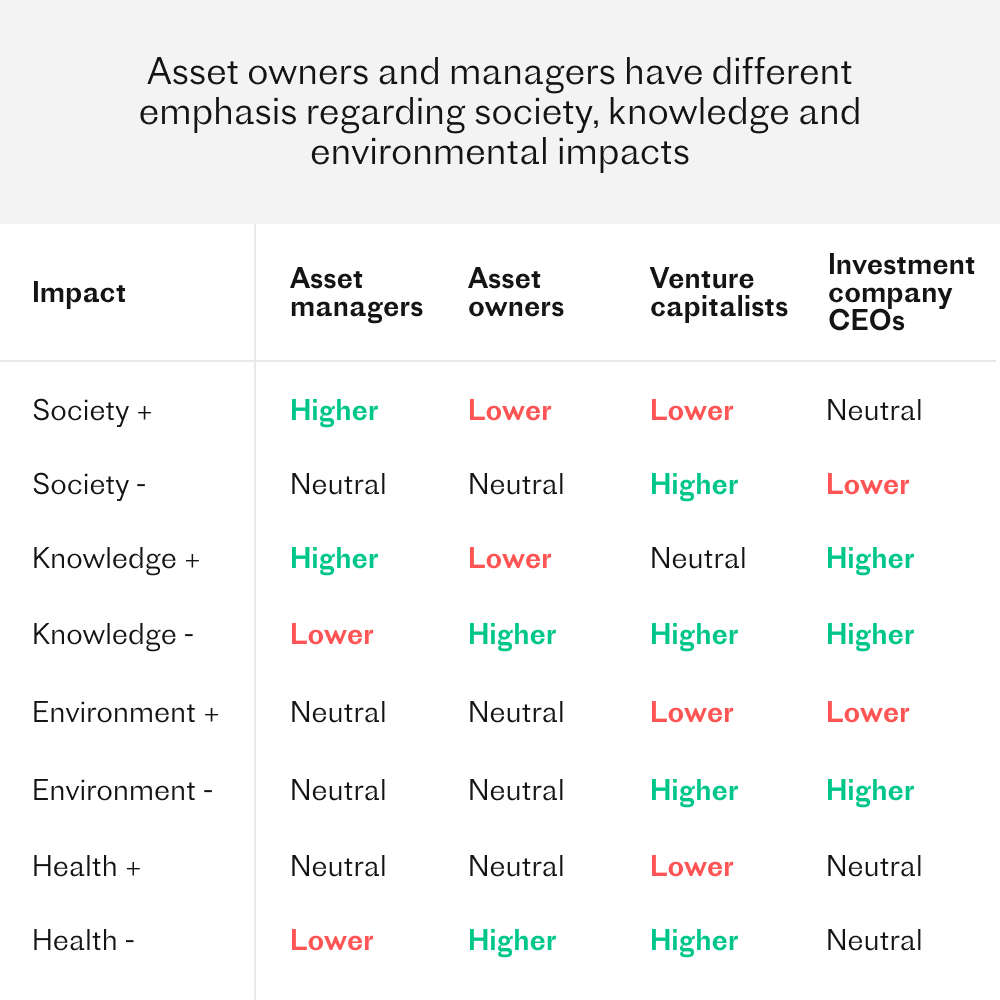
Figure 8.3.
How asset owners and managers value different impact categories compared to the average weight of an impact category*. Survey N=163
*Relative preferences of selected cohorts. Higher means that the coefficient from an ordinal linear regression on that impact category is significantly higher compared to the coefficients from other impacts for that cohort. Lower means the opposite. Neutral indicates there are significantly higher and lower coefficients in that cohort.
*65 % of asset managers stated client needs and wants as a rationale for pursuing positive impact, and 58 % as a reason for avoiding negative impact
These differences in values highlight a need for more to-the-point discussion about impact between asset managers and owners, as 65 % of managers stated client needs as one of their main rationales for pursuing impact*. More concreteness on the optimization criteria for a “good fund” is needed in order for asset owners to find asset managers whose priorities are aligned with theirs.
Companies’ own disclosures are not enough
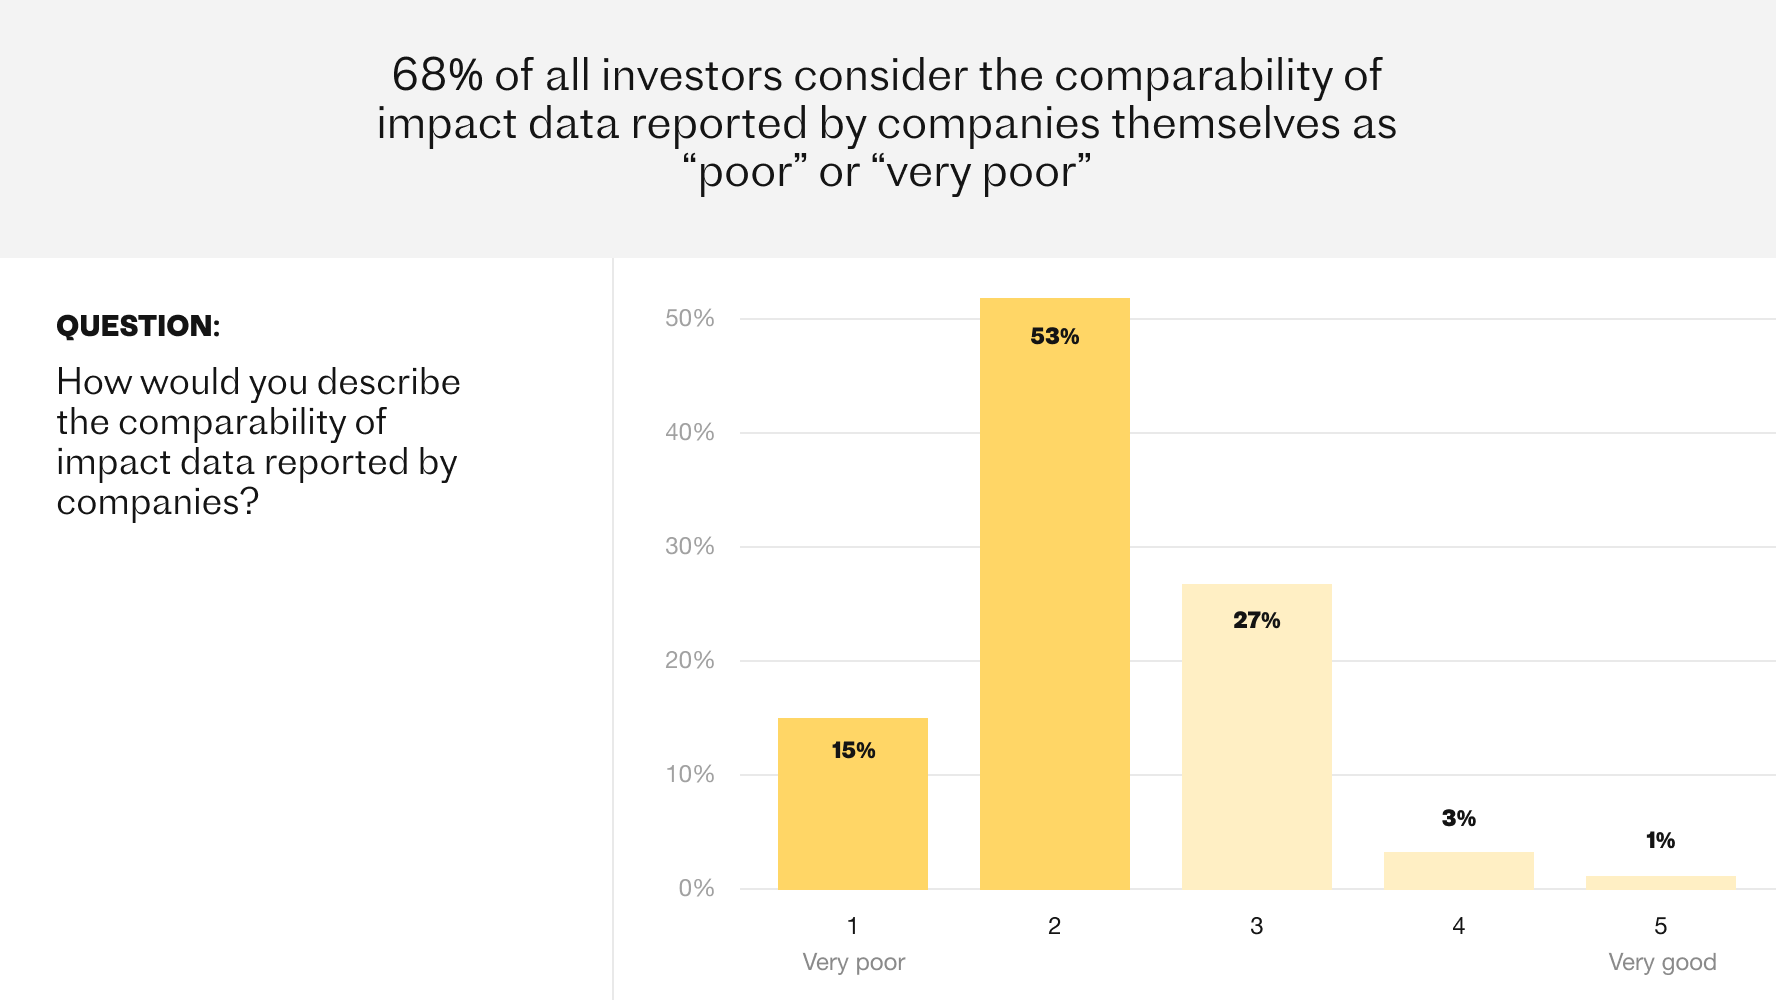
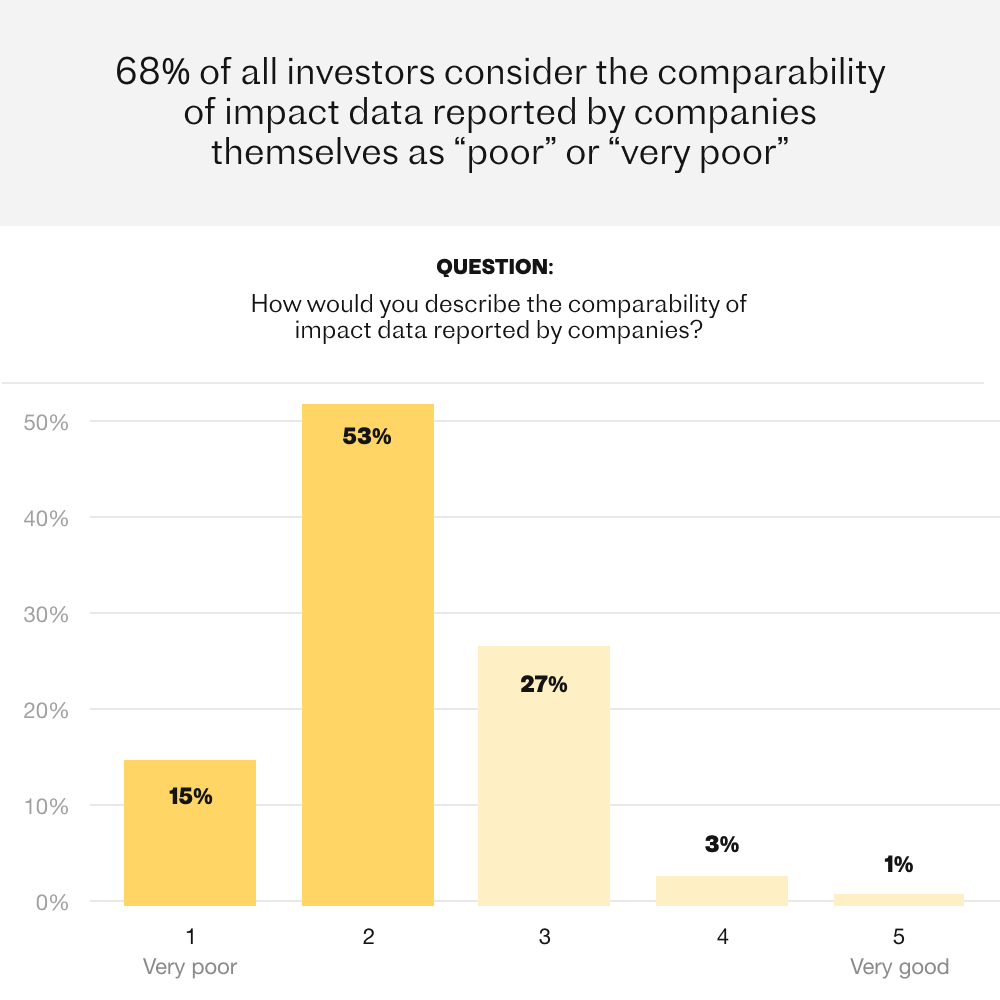
The majority of respondents, 68 %, regard the comparability of impact data disclosed by companies themselves as poor or very poor (Figure 8.3). This comes as little surprise to anyone who has actually tried to use data from multiple companies and compare data points to one another. It is quite hard, as varying depths of value chains have been taken into account and other definitions vary, too.
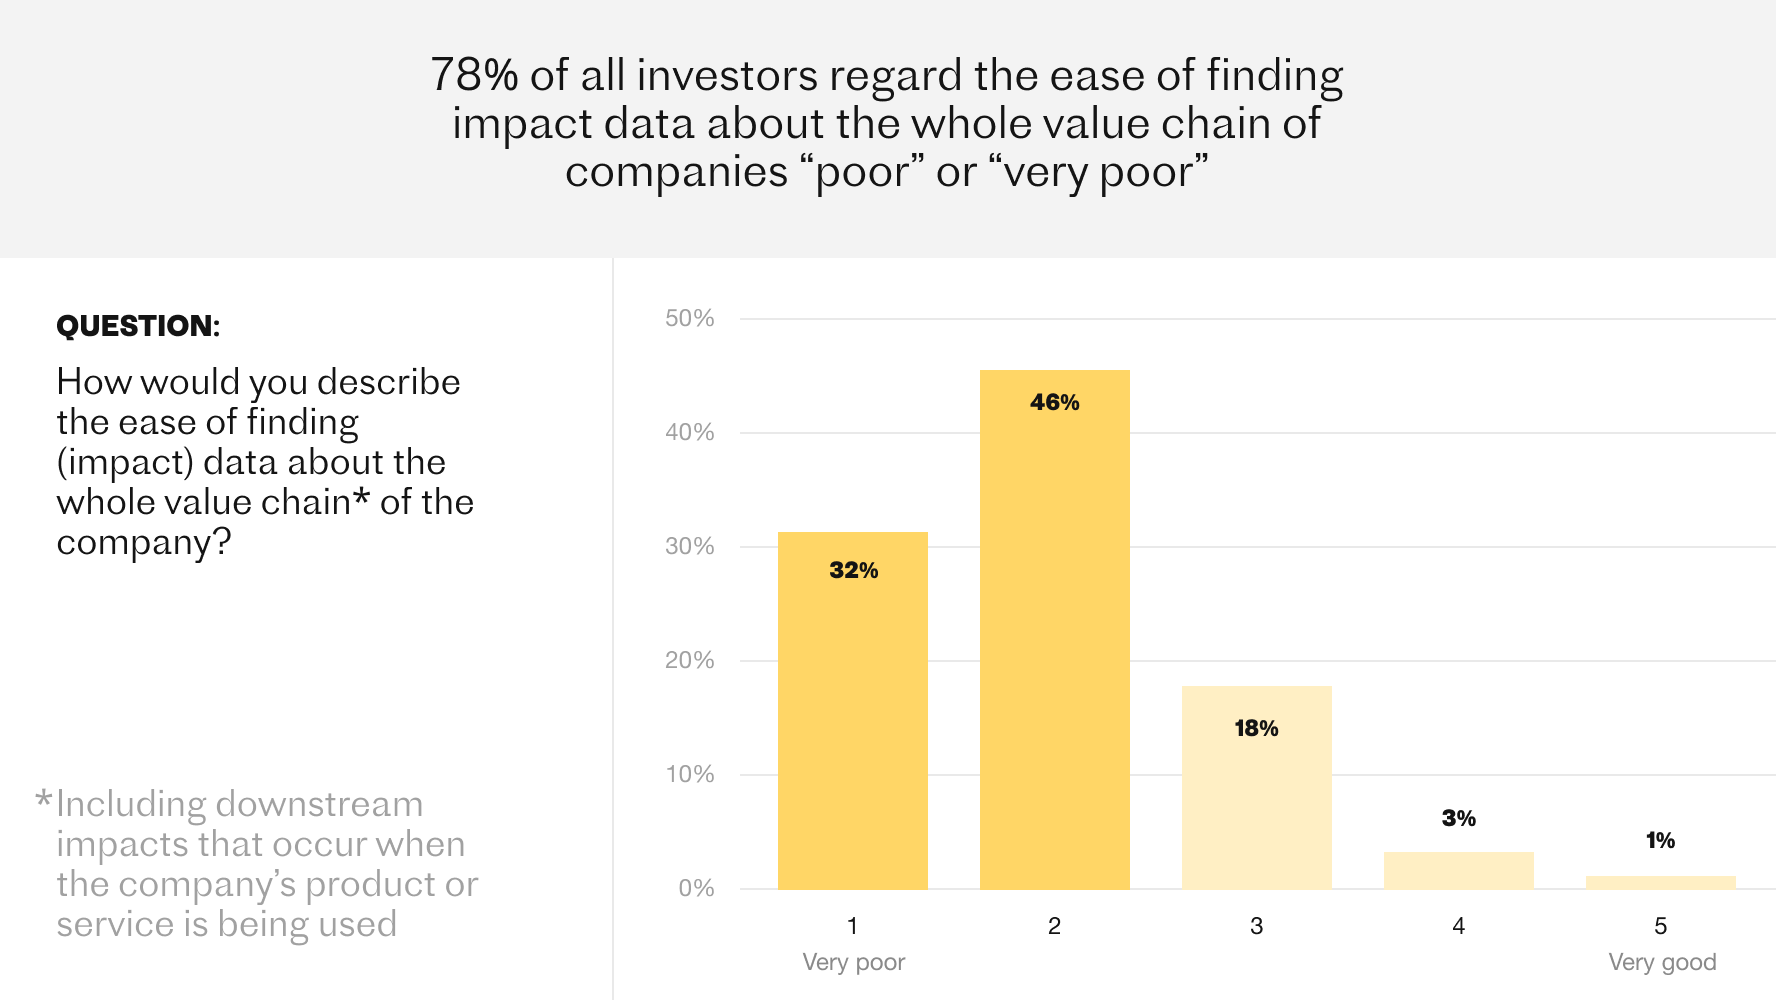
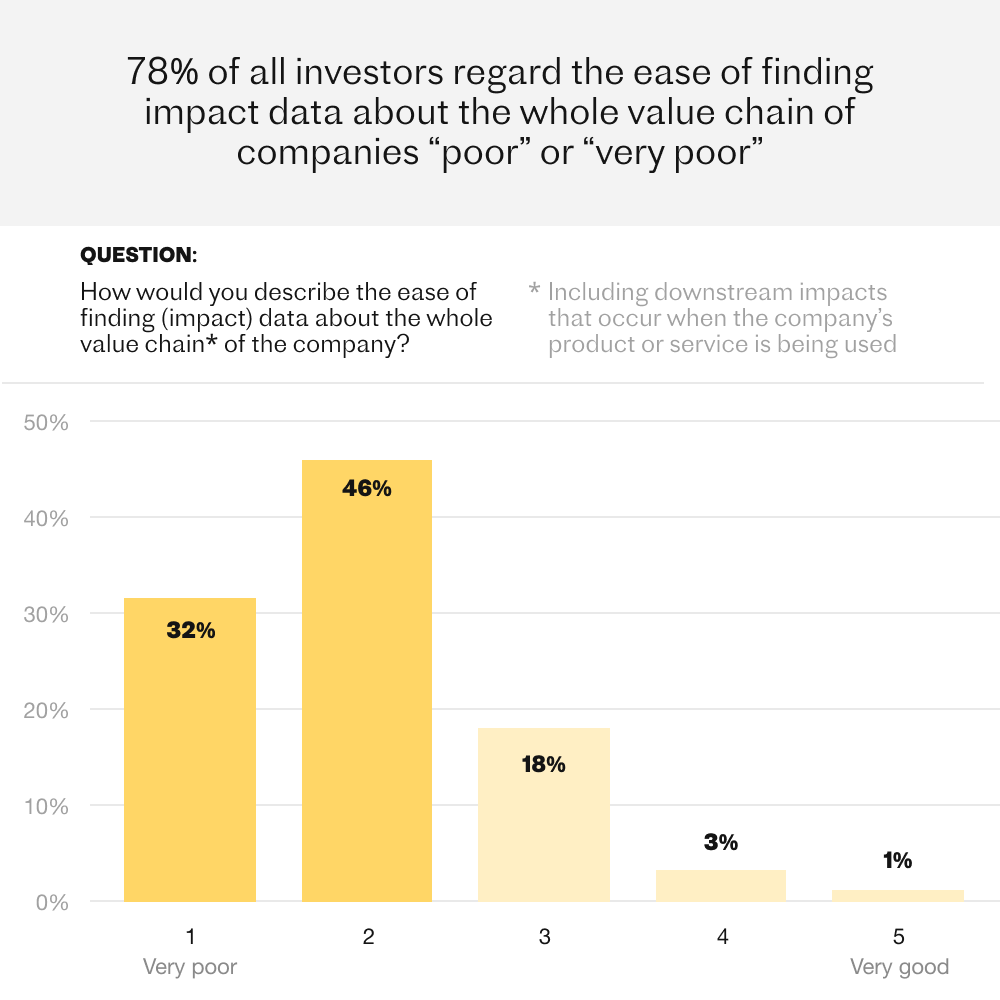
A whopping 78 % were dissatisfied with the ease of finding proper value chain data. This too is hardly a shock for anyone who has tried to go beyond “Scope 3” or even to reach it, and very few data sources even try to cover the whole value chain, let alone succeed in it.
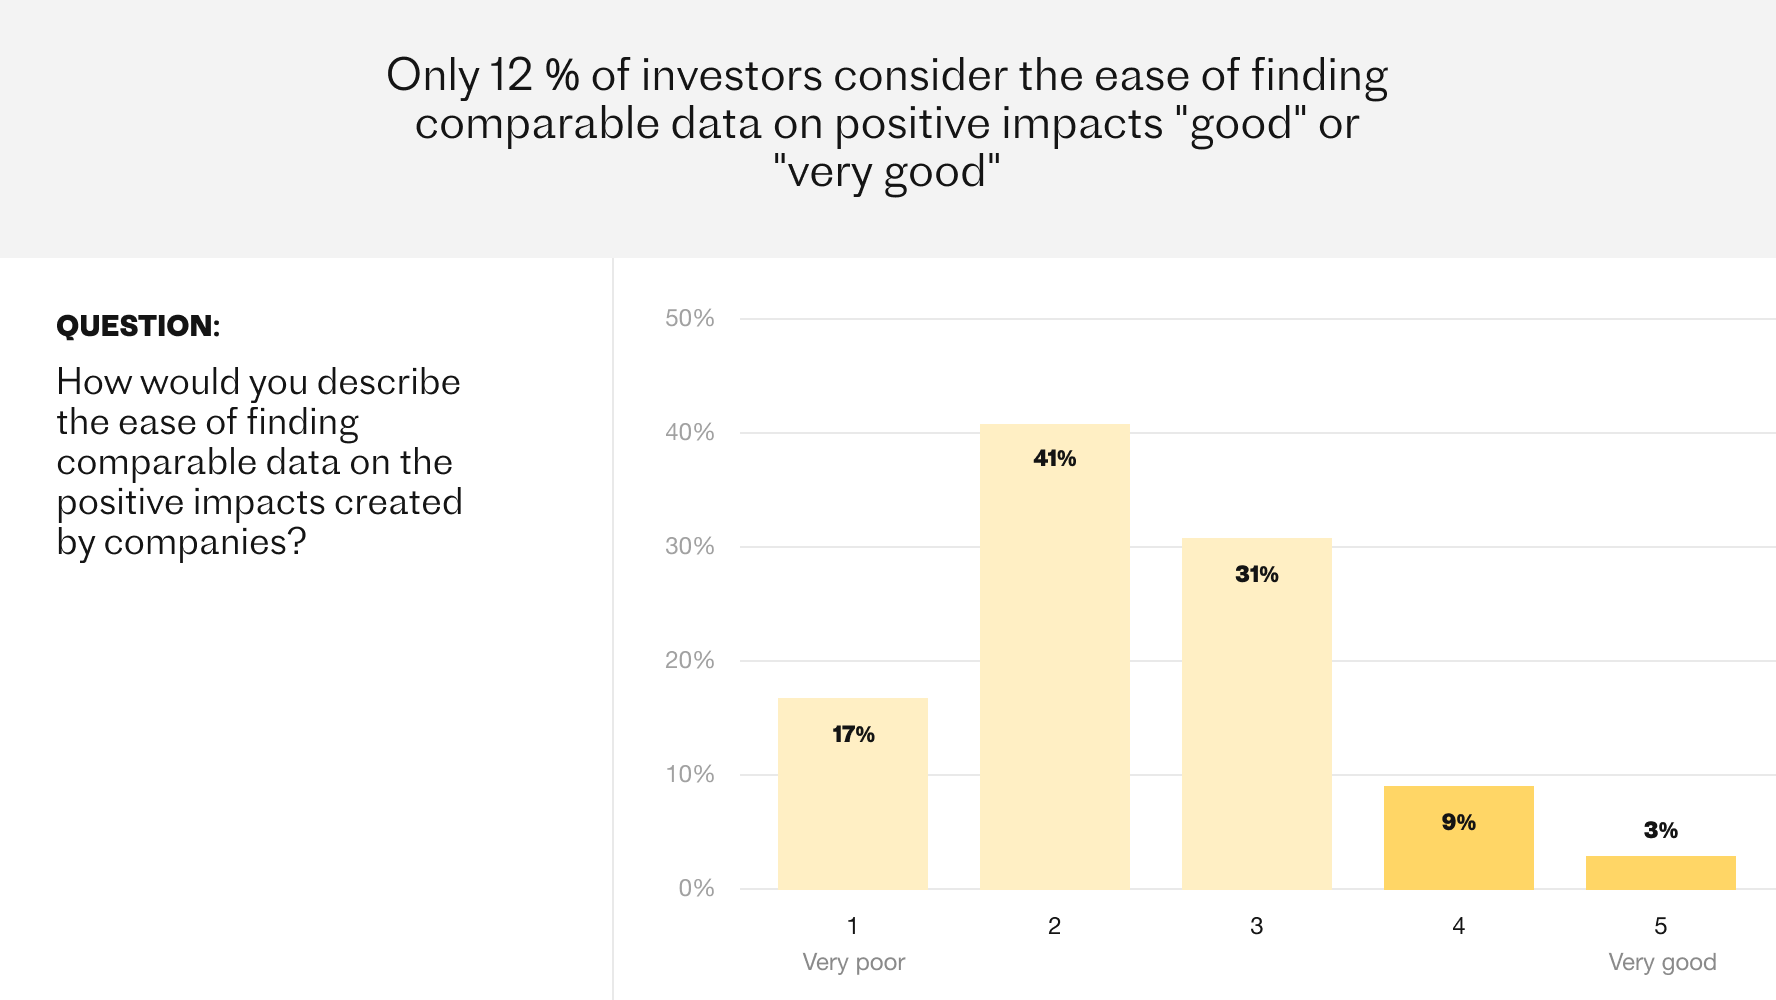
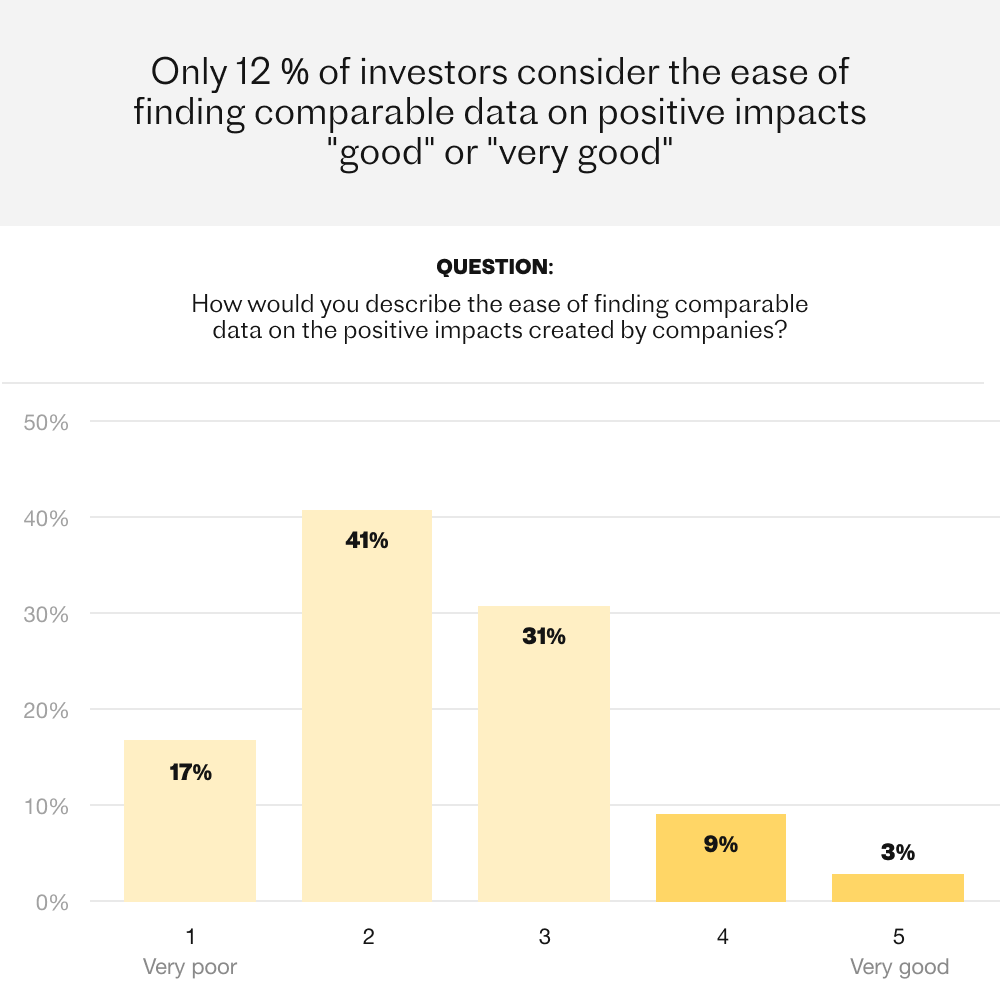
While negative impacts have traditionally been the focus in reporting and ratings, respondents are not satisfied with the ease of finding data on positive impacts created by companies (Figure 8.5).
Rank your investments by asset owner priorities
So how well do your funds serve the optimization criteria set by your asset owners, employees or other stakeholders? There is one easy way to find out: stress testing the net impact of your portfolio against different value priorities.
Concretely, you can do that for any company or fund on the Upright Net Impact Platform. But let’s examine one example together.
A fund’s net impact stress-tested against different stakeholder values - Case Franklin Templeton
To illustrate how the values of different investor groups affect the net impact ratio of a fund or a portfolio, we had a closer look at Templeton World Fund, holding 3.2 billion US dollars under management. The fund, managed by the US holding company Franklin Templeton (AUM $1.4 trillion), consists of large cap value stocks from companies located worldwide.
When looking at the net impact profile of Templeton World Fund (see Figure 8.7), its relatively large health impacts draw attention. The positive impact the fund has on the health of people is mainly driven by a variety of medical companies like the medical device producer Medtronic and the clinical laboratory operator LabCorp, to mention a few. The negative effect on people’s health is caused for the largest part by companies like the Japanese Kirin Brewery, producing alcoholic beverages and soft drinks. Other contributors include automotive companies, like Honda Motor adding to road traffic.
Furthermore, many companies in the fund have both positive and negative effects on human health. A good example is Walt Disney, the entertainment conglomerate that, on one hand has a substantial impact on increasing the sense of meaning and joy, but on the other hand also causes sedentary behaviour via e.g. its streaming services.
Another noteworthy feature of the net impact profile of Templeton World Fund is its significant negative environmental impacts, specifically the large greenhouse gas emissions caused by the portfolio companies. Most of these impacts are caused by the usual suspects: for instance, the multinational petroleum companies Shell and BP, airline companies, like the Anglo-Spanish International Airlines, alongside multiple automobile and engine manufacturers: e.g. Hino Motors, Isuzu Motors, and BorgWarner.
*Net impact ratio represents the net impact of a fund. It is defined as:
(positive impacts - negative impacts) / positive impacts
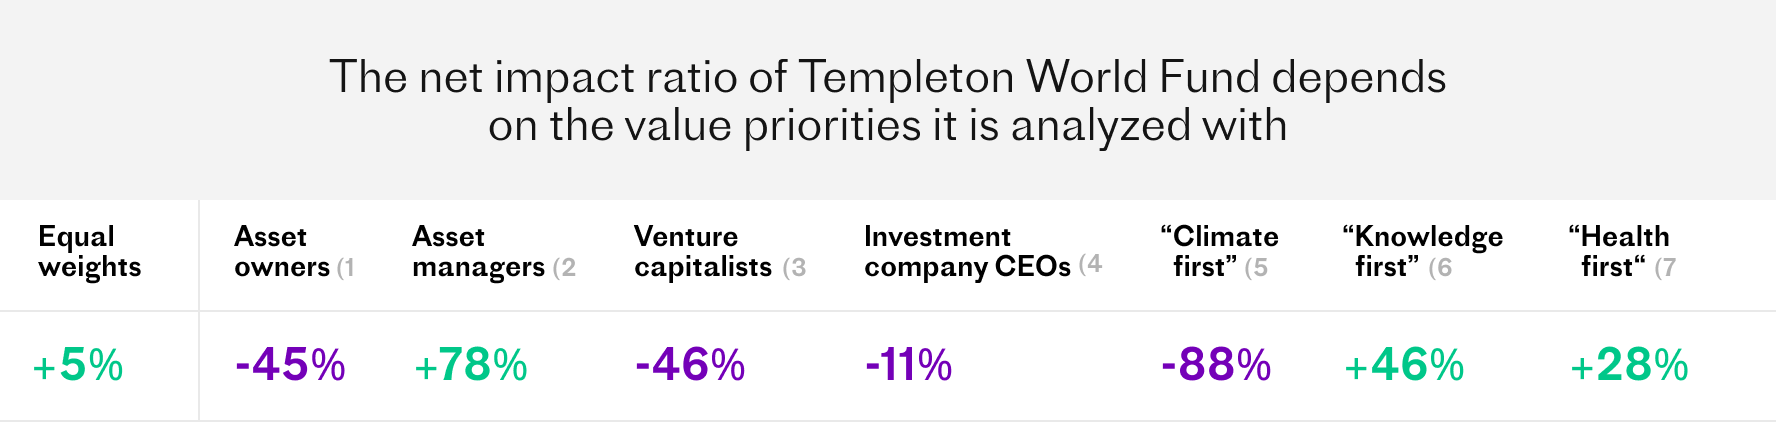
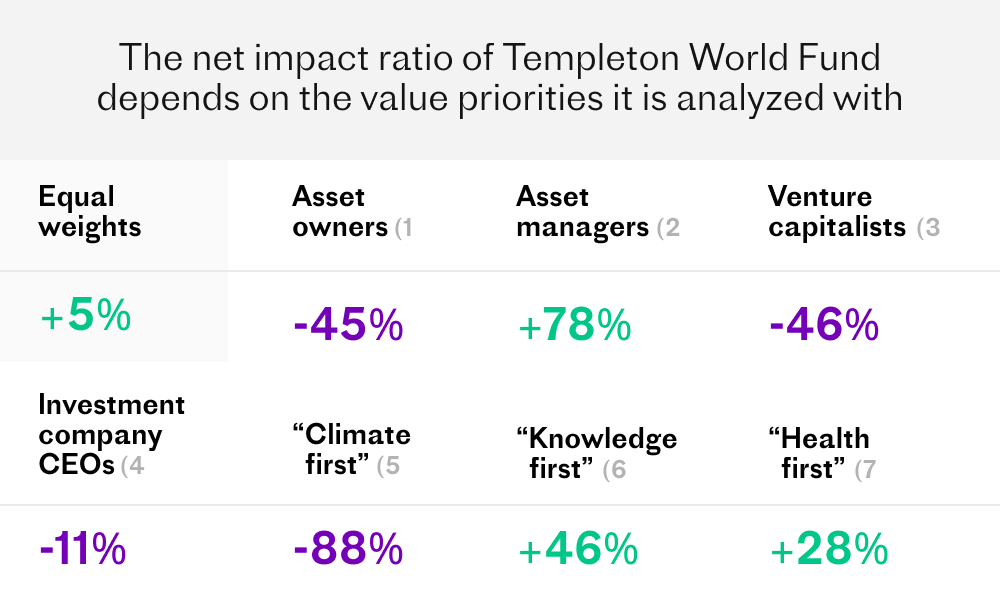
1) Values of asset owners, based on Upright's latest Investor survey.
2) Values of asset managers, based on Upright's latest Investor survey.
3) Values of venture capitalists, based on Upright's latest Investor survey.
4) Values of investment company CEOs, based on Upright's latest Investor survey.
5) Values that emphasize climate impacts over other impacts
6) Values that emphasize knowledge impacts over other impacts.
7) Values that emphasize health impacts over other impacts
As mentioned previously, asset managers emphasize pursuing positive societal impacts and deprioritize minimizing negative environmental impacts. This highlights the studied fund's large positive societal contribution to the world, in addition to toning down its negative environmental impacts. This leads to the net impact ratio of the fund increasing by over 70 percentage points.
The tables are turned when scrutinizing the fund from the point of view of asset owners. With asset owners' value preferences (See Figure 8.6), the fund’s negative impacts on the environment and knowledge get highlighted, while its largest positive impacts get played down. This results in the net impact ratio of Templeton World Fund dropping to the negative side.
As this example illustrates, regardless of whether you’re analyzing a portfolio, fund or a company, it is crucial for investors to stress test their investments against different value priorities.regardless of whether you’re analyzing a portfolio, fund or a company, it is crucial for investors to stress test their investments against different value priorities. Interested in understanding how this looks like in practice? Check out which companies and funds are winners in the eyes of different stakeholder groups in the Datasets chapter or by ranking companies against value sets that most interest you in The Upright Net Impact Platform.